The MAPE Illusion in Marketing Mix Modeling
Why a Better Fitting Model Doesn’t Mean Better Attribution
In Data Science, predictive fit metrics like Mean Absolute Percentage Error (MAPE) or R² are our compass. It is highly intuitive—and common practice—to assume that if an MMM accurately predicts historical sales, its underlying assumptions about media Return on Ad Spend (ROAS) must also be accurate.
However, Media Mix Modeling is an exercise in causal inference, not just forecasting. I recently built a fully simulated Bayesian MMM from scratch to test this assumption, and the results highlight a dangerous trap: optimizing for predictive fit can actively degrade your ROAS estimates, particularly when using uncertain or conservative priors.
The Simulation Setup To prove this, we need ground truth. I simulated 2 years of weekly data across 40 geographic markets with two independent marketing channels:
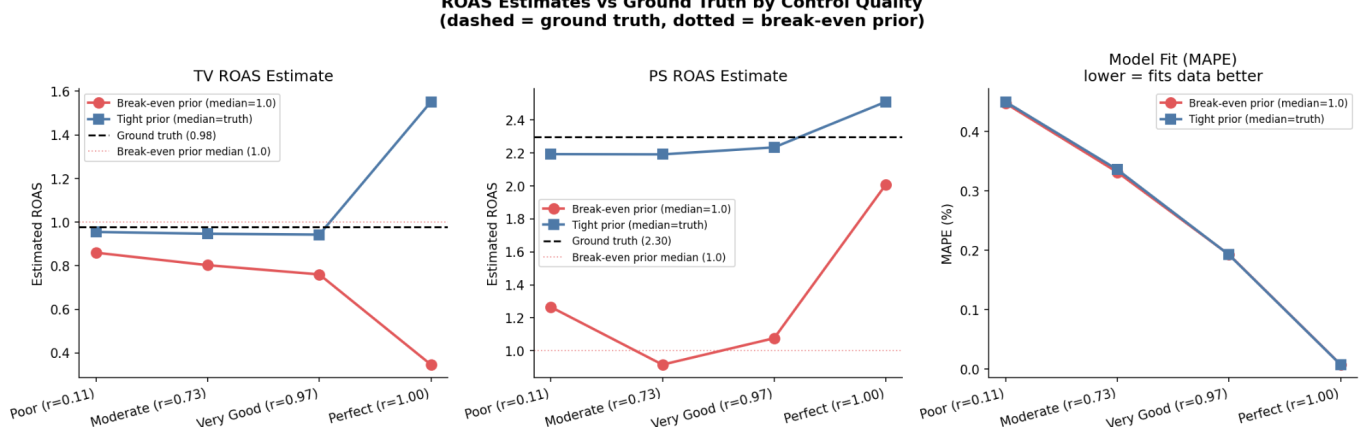
TV: True ROAS = $0.98 (near break-even).
Paid Search (PS): True ROAS = $2.30 (highly effective).
An Important Caveat: This is a simplified “easy mode” dataset. The spend is exogenous, and the channels are independent (no multicollinearity). This isolates the mathematical behavior of the model before we introduce real-world confounding factors.
The Test: Demand Controls and Prior Calibration I fed this data into Google Meridian and tested how the model behaved across a grid of two variables:
Demand Proxy Quality: I introduced control variables with varying correlations to the true unobserved baseline demand, ranging from “Poor” (r=0.11) to “Very Good” (r=0.97).
Priors: I tested “Tight” priors (centered exactly on the true ROAS) versus “Break-even” priors (a common, conservative approach where the prior median is set to 1.0 for all channels).
The Results: The MAPE Illusion The results exposed a fundamental paradox. Look at what happens to the causal attribution under the “conservative” Break-even prior as we give the model better demand controls:
Poor Control (r=0.11): MAPE is 0.4%. TV ROAS error is -12.0%, PS error is -44.9%.
Very Good Control (r=0.97): MAPE improves to 0.2%. But TV ROAS error worsens to -22.2%, and PS error worsens to -53.2%.
As the predictive fit of the model strictly improved, the accuracy of the ROI estimates degraded significantly.
(Note: As a theoretical oddity, providing a “Perfect” control with r=1.00 drove MAPE to a flawless 0.0%, but resulted in practically meaningless ROAS estimates, with TV error plummeting to -64.6%. The perfect control completely collapses the model’s ability to identify media effects).
Why Does This Happen? Media models rely heavily on temporal variation to identify causal effects. When you introduce a high-quality demand control, that control absorbs the temporal variation in the outcome variable.
The model essentially gets lazy. It can achieve an excellent MAPE simply by leaning heavily on the “Very Good” control variable to predict sales. Because the shape and saturation curves of media channels are notoriously hard to identify, the model loses the signal it needs to attribute sales to media. Bereft of strong data signals, the Bayesian sampler falls back heavily on your priors.
If your priors are miscalibrated—such as assuming a 1.0 ROAS for Paid Search when it is actually driving a 2.30 ROAS—the model will confidently pull your estimates down to match the bad prior, all while flashing a pristine 0.2% MAPE.
The Takeaway Absent a known ground truth, it is incredibly tempting to point to a low MAPE and conclude that your media assumptions are correct. This simulation proves that is a false comfort. No amount of control variable engineering can rescue a miscalibrated prior. To get true incrementality out of a Bayesian MMM, you must actively calibrate your priors, possibly using incrementality experiments, rather than relying on predictive fit metrics.
Next Steps: While demand controls hurt attribution in this simplified, exogenous scenario, real-world marketing is messy. In my next study, I will introduce endogenous spend (where past sales dictate future budget) and correlated channels to test whether demand controls finally prove their worth in de-biasing more realistic confounding environments.
Find me on the web and social media
TikTok (~30k subscribers)
LinkedIn (over 10k followers)
Instagram (help me grow!)
YouTube (longer form tutorial videos)